usingNeuroAnalyzerusingCairoMakieCairoMakie.activate!(type="png")usingStatisticsNeuroAnalyzer.progress_bar =falseNeuroAnalyzer.Random.seed!(42)# NEURO object with one channel from a signal vector# (used in the examples below)functionsignal2obj(s::Vector{Float64}, fs::Int64) obj =create_object(; data_type ="eeg") obj.header.recording[:sampling_rate] = fsadd_channel!(obj; data =reshape(s, 1, :, 1), label ="s",type="eeg", unit ="μV")create_time!(obj; fs = fs)return objend# Makie figure and axis settings matching NeuroAnalyzer plotsfig_size = (900, 450)ax_style = (titlesize =18, xlabelsize =18, ylabelsize =18, xticklabelsize =12, yticklabelsize =12, xticks =LinearTicks(10), xminorticksvisible =true, xminorticks =IntervalsBetween(10), xautolimitmargin = (0, 0), yautolimitmargin = (0.1, 0.1))# raw (unfiltered) EEG recordingeeg =import_edf("files/eeg/eeg.edf")
A filter changes the frequency content of a signal: it attenuates some frequencies and passes others. In EEG/MEG processing, filters are used to:
remove slow drifts and DC offsets (high-pass filter),
remove high-frequency noise, e.g. muscle activity (low-pass filter),
remove power-line noise at 50 or 60 Hz (band-stop or notch filter),
isolate a frequency band, e.g. alpha (band-pass filter), for analyses of amplitude or phase.
Filters are linear and time-invariant (LTI): the filtered sum of signals equals the sum of the filtered signals, and the filter acts in the same way at every time point. A signal can therefore be thought of as a sum of sine waves (see Fourier transform): the filter scales the amplitude of each sine wave and shifts its phase, without creating new frequencies.
Filtering is never free: every filter distorts the signal in time. Choosing a filter is a trade-off between how cleanly it separates frequencies and how much it smears the signal in time.
Filter Types
Type
Passes
Typical use in EEG
low-pass (LP)
frequencies below the cutoff
remove muscle activity and high-frequency noise
high-pass (HP)
frequencies above the cutoff
remove DC offsets, slow drifts, sweating artifacts
band-pass (BP)
frequencies between two cutoffs
isolate a band (e.g. alpha 8-12 Hz) for amplitude/phase
band-stop (BS)
all except frequencies between two cutoffs
remove line noise (50/60 Hz)
notch
all except one narrow band
remove line noise
The ideal filters above (a rectangular “brick-wall” response) cannot be built: a real filter needs a transition band between the frequencies it passes and those it stops.
Describing a Filter
Frequency response (magnitude, gain): how much each frequency is attenuated, usually in decibels:
pass band: the frequencies that are passed (gain close to 0 dB); small variations are the pass-band ripple,
stop band: the frequencies that are attenuated; the minimum attenuation is the stop-band attenuation,
transition band: between them; its width (bw in NeuroAnalyzer) determines how steep the filter is (roll-off),
cutoff frequency: a reference point in the transition band, usually the frequency at which the gain is −3 dB (half power) or −6 dB (half amplitude); which one depends on the filter design (see below), so the cutoff alone does not describe a filter.
Impulse response: the output of the filter when the input is a single impulse (one sample of 1, all other samples 0). The impulse response describes the filter completely: filtering is the convolution of the signal with the impulse response, and the frequency response is the Fourier transform of the impulse response. A sharp frequency response (narrow transition band) requires a long impulse response, i.e. more smearing in time.
Phase response: how much each frequency is shifted in time. A filter whose phase shift is proportional to frequency (linear phase) delays all frequencies by the same time (the group delay) and keeps the shape of the signal; a non-linear phase delays different frequencies differently and distorts the waveform.
FIR and IIR Filters
Digital filters are of two kinds:
FIR (finite impulse response): the output is a weighted sum of the current and past input samples:
\[
y[n] = \sum_{k=0}^{N-1} b_k \, x[n-k]
\]
The weights \(b_k\) (the filter kernel, taps or coefficients) are the impulse response, which has a finite length of \(N\) samples.
IIR (infinite impulse response): the output also depends on past output samples (feedback):
Because of the feedback, the impulse response decays but never reaches exactly zero.
FIR
IIR
impulse response
finite (N samples)
infinite (decays)
stability
always stable
stable if well designed (poles inside the unit circle)
phase
linear (symmetric kernel): constant delay
non-linear: frequency-dependent delay
length for a steep filter
long (hundreds to thousands of taps)
short (order 2-10)
computation
slower
faster
design parameters
cutoff, transition band width (or number of taps)
cutoff, order
typical EEG use
band-pass for phase analyses, steep LP/HP
HP/LP for preprocessing, notch
Order: for an FIR filter, the number of taps \(N\) (in some texts \(N - 1\)); for an IIR filter, the number of poles (the highest delay of the feedback). A higher order gives a steeper roll-off, but for FIR filters also a longer impulse response, and for IIR filters a longer ringing and a higher risk of numerical problems.
Poles and zeros
The transfer function of a filter (its Z-transform, see Z-transform below) is a ratio of two polynomials:
The roots of the numerator are the zeros (\(z_i\), frequencies that are suppressed), the roots of the denominator the poles (\(p_i\), frequencies that are amplified), \(k\) is the gain. An IIR filter is stable if all its poles lie inside the unit circle; an FIR filter has all its poles at \(z = 0\) and is always stable.
A Butterworth band-pass filter, 10-20 Hz, order 4:
flt =filter_create(fprototype =:butterworth, ftype =:bp, cutoff = (10, 20), order =4, fs =100)println("poles: ", length(flt.p), ", zeros: ", length(flt.z),", gain: ", round(flt.k; sigdigits =3))println("all poles inside the unit circle: ", all(abs.(flt.p) .<1))
poles: 8, zeros: 8, gain: 0.00482
all poles inside the unit circle: true
plot_polezero(flt.p, flt.z)
FIR Filters
The Window Method
The ideal (rectangular) frequency response corresponds to an infinitely long impulse response (a sinc function). The window method cuts it to a finite length and multiplies it by a window (a taper), which smooths the truncation. The result is a filter with a transition band (whose width depends on the length of the kernel) and ripples in the pass and stop bands (whose size depends on the window).
The kernel of a low-pass FIR filter, 35 Hz, transition band 10 Hz, at 256 Hz:
flt =filter_create(fprototype =:fir, ftype =:lp, cutoff =35, bw =10, fs =256)println("taps: ", length(flt))# time of each tap relative to the center of the kernelt = ((1:length(flt)) .- (length(flt) +1) /2) ./256lines(t, flt; color =:black, figure = (size = fig_size,), axis = (ax_style..., title ="FIR low-pass kernel", xlabel ="Time [s]", ylabel ="Coefficient"))
taps: 85
The kernel is symmetric, so the filter has a linear phase.
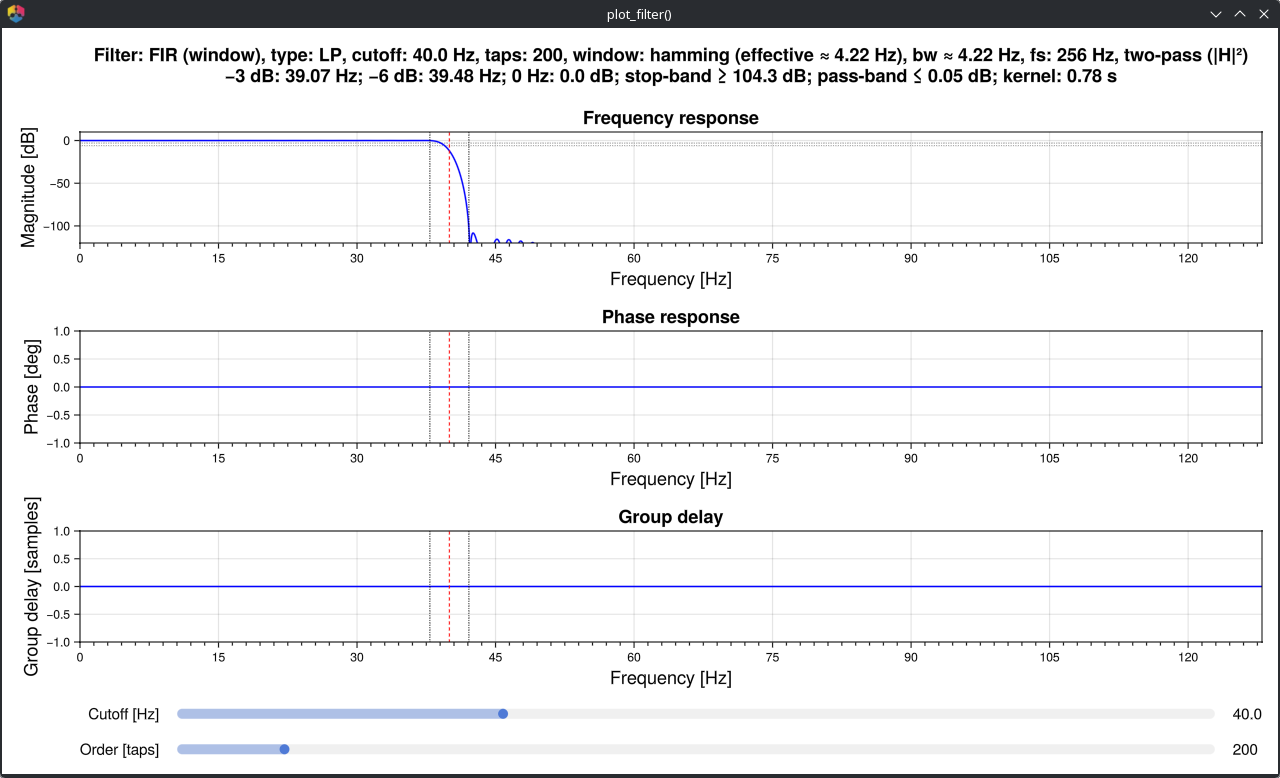
plot_filter() shows the frequency response, phase response and group delay of a filter designed with the same arguments as filter() (gui = false returns a static figure):
The title lists the measured properties of the filter: −3 dB and −6 dB points, pass-band ripple, stop-band attenuation and the length of the kernel. For FIR filters designed with the window method, cutoff is the −6 dB point of a single pass (the middle of the transition band); with two passes (default) the gain at the cutoff is −12 dB, and the −3 dB point (32.8 Hz here) lies below the cutoff.
Windows
The window (window) sets the trade-off between the transition band width, the pass-band ripple and the stop-band attenuation. For the same transition band, windows with a higher attenuation need longer kernels:
println(rpad("window", 10), rpad("taps", 7), rpad("ripple [dB]", 14),"attenuation [dB]")for w in [:rect, :hann, :hamming, :blackman] f =filter_create(fprototype =:fir, ftype =:lp, cutoff =35, bw =10, fs =256, window = w) r =filter_report(f; fs =256, dir =:onepass, ftype =:lp, cutoff =35, bw =10, verbose =false)println(rpad(w, 10), rpad(length(f), 7), rpad(r.pass_dev, 14), r.stop_att)end
The default Hamming window is a good compromise. A custom window (a vector of the length of the kernel) can be given with w; its length sets the number of taps.
Number of taps
When bw is given, the number of taps is computed from the transition band width; it can also be set directly with order. filter_order() returns the number of taps for a given transition band (rounded up to an odd number, which gives a linear-phase filter of any type):
\[
N = k \frac{f_s}{bw}
\]
with \(k\) = 0.9 (rectangular), 3.1 (Hann), 3.3 (Hamming) or 5.5 (Blackman):
A transition band of 0.5 Hz (e.g. for a high-pass filter at 0.5 Hz) requires a kernel of almost 7 s.
Other estimates of the number of taps:
fir_order_bw(): harris’ rule for a given stop-band attenuation \(A\) (dB): \(N = \frac{A}{22} \frac{f_s}{bw}\),
fir_order_f(): a rule of thumb for band-pass filters used in time-frequency analyses: the kernel should contain 4-5 cycles of the lowest frequency of interest.
println("harris (bw = 2 Hz, 60 dB): ", fir_order_bw(eeg; bw =2, a =60))println("4-5 cycles of 8 Hz: ", fir_order_f(eeg; f =8))
IIR filters are designed from analog prototypes, which differ in the shape of the frequency response:
Prototype
Pass band
Stop band
Roll-off
cutoff is
:butterworth
maximally flat
monotonic
slowest
the −3 dB point
:chebyshev1
ripple (rp)
monotonic
steeper
the end of the pass band (gain −rp)
:chebyshev2
flat
ripple (rs)
steeper
the start of the stop band (attenuation rs)
:elliptic
ripple (rp)
ripple (rs)
steepest
the end of the pass band (gain −rp)
rp is the pass-band ripple (default 0.5 dB) and rs the stop-band attenuation (default 20 dB). The four prototypes as low-pass filters, order 6, cutoff 35 Hz, one pass:
println(rpad("prototype", 14), "gain at 30 Hz 40 Hz 45 Hz")for p in [:butterworth, :chebyshev1, :chebyshev2, :elliptic] f =filter_create(fprototype = p, ftype =:lp, cutoff =35, order =6, fs =256) r =filter_report(f; fs =256, dir =:onepass, fcheck = [30, 40, 45], verbose =false)println(rpad(p, 14), rpad(string(r.gain_at[30.0], " dB"), 15),rpad(string(r.gain_at[40.0], " dB"), 11), r.gain_at[45.0], " dB")end
prototype     gain at 30 Hz   40 Hz      45 Hz
butterworth   -0.52 dB       -8.68 dB   -15.58 dB
chebyshev1    -0.465 dB      -14.716 dB -27.004 dB
chebyshev2    -1.088 dB      -20.05 dB  -30.117 dB
elliptic      -0.391 dB      -23.113 dB -20.199 dB
The Butterworth filter is the usual choice for EEG preprocessing: it has no ripple in the pass band, and its moderate roll-off produces less ringing than the steeper prototypes.
iir_order() estimates the order needed for a given transition band:
n =iir_order(eeg; fprototype =:butterworth, ftype =:lp, cutoff =35, bw =10)println("Butterworth LP 35 Hz, transition band 10 Hz: order ", n)
Butterworth LP 35 Hz, transition band 10 Hz: order 11
45 Hz: -0.323 dB
49 Hz: -5.989 dB
50 Hz: -124.704 dB
51 Hz: -6.052 dB
55 Hz: -0.352 dB
Tip: Power-line noise often has harmonics (100, 150 Hz …) and varies in frequency and amplitude. A notch filter removes only one frequency; a low-pass filter below 50 Hz removes the line noise and its harmonics, and line noise removal methods remove it without filtering the neighboring frequencies.
Phase, Delay and Causality
A causal filter uses only the current and past samples: it can work in real time, but it delays the signal. A linear-phase FIR filter of \(N\) taps delays all frequencies by
\[
\tau = \frac{N - 1}{2 f_s}
\]
e.g. 0.164 s for the 85-tap filter above. An IIR filter delays different frequencies by different times, which changes the shape of the signal.
A non-causal filter also uses future samples. Recorded signals are filtered offline, so non-causal filters can be used; the usual one is the two-pass (forward-backward, zero-phase) filter: the signal is filtered, reversed in time, filtered again and reversed back. The phase shifts of the two passes cancel, so the result has no delay and no phase distortion. The magnitude response is squared: the attenuation in dB is doubled, and the gain at the cutoff of a Butterworth filter is −6 dB instead of −3 dB.
The direction is set with dir:
:twopass (default): forward and backward (zero phase),
:onepass: forward only (causal, delayed),
:reverse: backward only (anti-causal).
A simulated ERP (P1 at 100 ms, N1 at 170 ms, P3 at 350 ms) filtered with a Butterworth low-pass filter at 10 Hz:
fs =500t =collect(-0.2:(1/ fs):0.8)# Gaussian wave: latency t0 [s], amplitude a [μV], width w [s]g(t0, a, w) = a .*exp.(-(t .- t0) .^2./ (2* w^2))erp =g(0.1, 3, 0.015) .+g(0.17, -5, 0.02) .+g(0.35, 8, 0.06)# padded with 2 s of zeros on both sides (no edge artifacts)pad =zeros(2* fs)obj =signal2obj(vcat(pad, erp, pad), fs)idx = (length(pad) +1):(length(pad) +length(erp))erp_f =Dict{Symbol, Vector{Float64}}()for d in [:onepass, :twopass] f = NeuroAnalyzer.filter(obj; ch ="s", fprototype =:butterworth, ftype =:lp, cutoff =10, order =4, dir = d) erp_f[d] = f.data[1, idx, 1]endfig =Figure(size = fig_size)ax =Axis(fig[1, 1]; ax_style..., title ="Butterworth LP 10 Hz", xlabel ="Time [s]", ylabel ="Amplitude [μV]")lines!(ax, t, erp; color =:black, label ="original")lines!(ax, t, erp_f[:onepass]; label ="one pass")lines!(ax, t, erp_f[:twopass]; label ="two passes")axislegend(ax)fig
for d in [:onepass, :twopass]println(rpad(d, 9), ": P3 peak at ",round(Int, 1000* t[argmax(erp_f[d])]), " ms")end
onepass  : P3 peak at 394 ms
twopass  : P3 peak at 350 ms
The one-pass filter delays the P3 by about 40 ms and changes the shape of the components; the two-pass filter keeps the latencies.
Tip: Two-pass filters spread the signal backward in time as well as forward: a sharp event (e.g. a stimulus artifact or a response) can produce filter artifacts before it occurred. When the onset of an effect matters (e.g. ERP onset latencies), check the result with a causal filter.
Filter Artifacts
Distortion of the Signal
A filter changes every signal that has energy in its transition and stop bands, including the signal of interest. A high-pass filter removes slow drifts, but also slow ERP components such as the P3 or slow cortical potentials, and adds opposite-polarity deflections around them. The same simulated ERP, filtered with high-pass Butterworth filters (order 2, two passes):
fig =Figure(size = fig_size)ax =Axis(fig[1, 1]; ax_style..., title ="Butterworth HP, order 2", xlabel ="Time [s]", ylabel ="Amplitude [μV]")lines!(ax, t, erp; color =:black, label ="original")for c in [0.1, 1, 2] f = NeuroAnalyzer.filter(obj; ch ="s", fprototype =:butterworth, ftype =:hp, cutoff = c, order =2) s = f.data[1, idx, 1]lines!(ax, t, s; label ="HP $c Hz")println("HP ", rpad(c, 4), "Hz: P3 ",round(maximum(s[t .>0.25]); digits =1), " μV, N1 ",round(minimum(s[0.13.< t .<0.22]); digits =1), " μV")endaxislegend(ax)fig
HP 0.1 Hz: P3 7.7 μV, N1 -5.2 μV
HP 1.0 Hz: P3 5.7 μV, N1 -6.3 μV
HP 2.0 Hz: P3 3.7 μV, N1 -5.5 μV
With a 0.1 Hz high-pass filter the ERP is almost unchanged; with 1-2 Hz the P3 is strongly reduced and the N1 becomes larger, an artificial effect created by the filter. For ERPs, high-pass filters above 0.1-0.3 Hz should be avoided.
Ringing: steep filters (narrow transition bands, high orders, elliptic and Chebyshev prototypes) respond to sharp transients (spikes, steps, artifacts) with oscillations at the cutoff frequency, which can be mistaken for brain oscillations.
Edge Artifacts
At the start and end of a signal the filter has no data before (or after) it: the kernel overlaps the missing samples and the output is distorted for about the length of the impulse response. Long kernels (low cutoffs, narrow transition bands) produce long edge artifacts; a high-pass filter at 0.5 Hz can distort several seconds.
Edge artifacts are avoided by filtering the continuous signal and splitting it into epochs afterwards. Filtering short epochs puts edges into every epoch:
e=crop(keep_channel(eeg; ch ="eeg"); seg = (100, 160))# filter, then epoche1 =epoch(NeuroAnalyzer.filter(e; ch ="all", fprototype =:butterworth, ftype =:hp, cutoff =0.5, order =4); ep_len =2)# epoch, then filtere2 = NeuroAnalyzer.filter(epoch(e; ep_len =2); ch ="all", fprototype =:butterworth, ftype =:hp, cutoff =0.5, order =4)d =abs.(e1.data .- e2.data)println("mean |difference|, first 0.25 s of epochs: ",round(mean(d[:, 1:64, :]); digits =1), " μV")println("mean |difference|, 1.0-1.25 s of epochs: ",round(mean(d[:, 257:320, :]); digits =1), " μV")
mean |difference|, first 0.25 s of epochs: 189.5 μV
mean |difference|, 1.0-1.25 s of epochs:   32.5 μV
The epochs filtered separately differ from the correctly filtered signal everywhere (a 2-s epoch is shorter than the response of a 0.5 Hz filter), most at their edges. filter() warns when it is applied to an epoched object.
If a short segment must be filtered, pad it (e.g. with mirrored data) or taper its edges (multiply by a window such as Tukey) before filtering, and discard the edges afterwards.
Filtering EEG in Practice
Typical settings:
Filter
Setting
Notes
high-pass
0.1 Hz (ERPs), 0.5-1 Hz (other)
removes drifts; higher cutoffs distort slow components; 1 Hz is common before ICA
low-pass
30-45 Hz (ERPs, clinical), higher for gamma
removes muscle activity and line noise
notch
50 or 60 Hz
only if line noise remains and the band around it is not analyzed
band-pass
band of interest
for amplitude envelopes and phase (Hilbert transform); FIR, two passes
Guidelines:
filter as little as possible: every filter distorts the signal; analyses in the frequency domain (power spectra) often need no filtering at all,
filter the continuous signal, before epoching,
use two-pass (zero-phase) filters for offline analyses,
check the filter (plot_filter(), filter_report()) and the filtered signal,
report the filter in publications: type, prototype, cutoff and how it is defined (−3 dB or −6 dB), order or transition band, and direction (one or two passes).
The recording filtered 0.5-35 Hz (Butterworth high-pass, FIR low-pass):
The power spectra of the raw and filtered signals: the raw signal is dominated by the line noise at 50 Hz (and its harmonic at 100 Hz) and contains slow drifts; the filters remove both and keep the EEG activity between them:
s_raw =crop(eeg; seg = (100, 160))s_flt =crop(eeg_f; seg = (100, 160))p_raw =psd(s_raw; ch ="O1", db =true)p_flt =psd(s_flt; ch ="O1", db =true)fig =Figure(size = fig_size)ax =Axis(fig[1, 1]; ax_style..., title ="O1", xlabel ="Frequency [Hz]", ylabel ="Power [dB]")lines!(ax, p_raw.f, vec(p_raw.p); label ="raw")lines!(ax, p_flt.f, vec(p_flt.p); label ="0.5-35 Hz")axislegend(ax)fig
Filtering in NeuroAnalyzer
filter() designs and applies a filter in one step (filter!() modifies the object in place):
number of taps (FIR) or order (IIR); computed from bw for FIR filters if not given
bw
transition band width in Hz (FIR, notch width for :iirnotch)
window, w
FIR window (:rect, :hann, :hamming, :blackman) or a custom window/weight vector
rp, rs
pass-band ripple and stop-band attenuation in dB (Chebyshev, elliptic)
dir
:twopass (default), :onepass, :reverse
preview
if true, plot the response of the filter without filtering
The measured properties of the filter are printed (unless verbose is off) and stored in the processing history:
println(last(eeg_lp.history))
filter_apply(obj; ch=[1, 2, 3, 4, 5, 6, 7, 8, 9, 10, 11, 12, 13, 14, 15, 16, 19, 20, 21], dir=:twopass) [FIR, taps=85, dir=:twopass; -3 dB at 32.805 Hz; -6 dB at 33.782 Hz; 0 Hz: 0.0 dB; pass-band dev ≤ 0.05 dB; stop-band att ≥ 97.4 dB]
Designing and applying a filter in two steps
filter_create() designs the filter (returns the FIR kernel or the IIR filter), filter_report() measures it, and filter_apply() applies it, e.g. to several objects:
r =filter_report(flt; fs =sr(eeg), verbose =false)println(r.summary)
IIR, order=4, dir=:twopass; -3 dB at 0.559 Hz; -6 dB at 0.5 Hz; 0 Hz: -12306.106 dB
Previewing a filter
# response of the filter, the signal is not filteredNeuroAnalyzer.filter(eeg; ch ="eeg", fprototype =:fir, ftype =:lp, cutoff =35, bw =10, preview =true)# interactive filter designerplot_filter(eeg; fprototype =:fir, ftype =:lp, cutoff =35, bw =10)
Smoothing Filters
Smoothing filters are simple low-pass filters that work in the time domain. They are useful for removing noise from slowly changing signals (e.g. fNIRS, pupil size, behavioral data) and for removing spikes. A test signal (2 Hz sine wave with noise and three spikes):
the (weighted) mean of \(2k + 1\) samples around it
random noise
moving median
filter_mmed()
the median of \(2k + 1\) samples around it
spikes, outliers
Savitzky-Golay
filter_sg()
the value of a polynomial fitted to window samples around it
noise, keeping peak heights and widths
polynomial
filter_poly()
a polynomial fitted to consecutive windows
slow signals
s_mavg =filter_mavg(obj; ch ="s", k =8).data[1, :, 1]s_mmed =filter_mmed(obj; ch ="s", k =8).data[1, :, 1]s_sg =filter_sg(obj; ch ="s", order =3, window =31).data[1, :, 1]fig =Figure(size = fig_size)ax =Axis(fig[1, 1]; ax_style..., title ="Smoothing filters", xlabel ="Time [s]", ylabel ="Amplitude [μV]")lines!(ax, t, s; color = (:gray, 0.5), label ="signal")lines!(ax, t, s_mavg; label ="moving average (k = 8)")lines!(ax, t, s_mmed; label ="moving median (k = 8)")lines!(ax, t, s_sg; label ="Savitzky-Golay (3, 31)")axislegend(ax; position =:rb)fig
The moving average smears the spikes over its window; the moving median removes them.
Moving average
The moving average of \(N = 2k + 1\) samples is an FIR filter with equal weights. Its frequency response has zeros at multiples of \(f_s / N\) and large side lobes, so it is a poor low-pass filter, but it is simple and does not create ringing. Its approximate cutoff (−3 dB) is
e.g. 6.7 Hz for \(k = 8\) at 256 Hz. A weighting window ww (length \(2k + 1\)) gives a weighted moving average, e.g. ww = [1, 2, 3, 2, 1] (with k = 2) a triangular one.
With a threshold t > 0, filter_mavg() and filter_mmed() replace only the samples outside mean ± t × SD of the signal, which removes outliers and keeps the rest of the signal unchanged:
s_out =filter_mmed(obj; ch ="s", k =8, t =3).data[1, :, 1]println("samples changed: ", count(s_out .!= s))
samples changed: 3
Gaussian Filter
filter_g() extracts the amplitude envelope of a frequency band: the FFT of the signal is multiplied by a Gaussian centered at frequency f (width gw in Hz), keeping only the positive frequencies, and transformed back. The result is the analytic signal of the band (as with the Hilbert transform); filter_g() returns its absolute value, the envelope:
The test signal is a 10 Hz oscillation whose amplitude changes slowly (between 2 and 8 μV), with a 20 Hz sine wave of 3 μV:
The Gaussian has no sharp edges, so the filter does not ring; its frequency resolution is set by gw: a narrow Gaussian separates close frequencies but follows fast amplitude changes less precisely. The same Gaussian kernels are used by the filter-Hilbert (:gh) time-frequency method.
Z-Transform
The Z-transform describes a discrete-time signal or system in the complex plane:
\[
X(z) = \sum_{n=-\infty}^{\infty} x[n] \, z^{-n}, \qquad z = r e^{i\omega}
\]
On the unit circle (\(r = 1\), \(z = e^{i\omega}\)) it is the discrete-time Fourier transform: the angle \(\omega\) goes from 0 (0 Hz) to \(\pi\) (the Nyquist frequency). Inside and outside the circle, it also describes exponentially decaying and growing signals, which makes it the natural tool for IIR filters.
Filtering (convolution in time) becomes multiplication in the Z-domain:
\[
Y(z) = H(z) \, X(z)
\]
where \(H(z)\), the Z-transform of the impulse response, is the transfer function of the filter. For FIR and IIR filters it is the ratio of polynomials shown in Poles and zeros. Evaluated on the unit circle, \(H(e^{i\omega})\) is the frequency response: the gain at a frequency is low near a zero and high near a pole, and a pole outside the unit circle makes the impulse response grow without bound (an unstable filter).